Engineering machine learning / case study 01Cork, Ireland · UCC / Tyndall

Same tag.
New geometry.
Different answer.

Recognising a chipless RFID tag when the reader moves.

A chipless tag carries identity in its electromagnetic response. I investigated whether machine learning could recognise seven tag identities when the reader’s distance and angle changed.

My role Signal processing, ML evaluation and failure analysis using an existing UCC / Tyndall measurement campaign.

From physical tag to predicted identityConcept illustration
A reader measures a chipless tag’s electromagnetic responseA reader illuminates a patterned tag and receives its reflected response. Changing the distance and angle changes the measurement. A conceptual spectrum is passed to a classifier to predict tag identity. This is a schematic, not a photograph of the apparatus or measured data. ReaderSend / receive Illuminate Reflected response Chipless tagPattern encodes identity Distance + angle can change Illustrative spectrum ML modelInterpret response Tag identity1 of 7 classes
A patterned tag shapes the reflected signal. The challenge: recognise its identity even when the measurement changes. Schematic only; tag shape and trace are illustrative.

MEngSc research · Yangdeyi Yang · University College Cork / Tyndall National Institute. Analysis of an existing measurement campaign; my contribution is the ML evaluation and investigation.

01 / Understand the measurement

How a tag becomes
a spectrum.

Think of a chipless RFID tag as an electromagnetic barcode. Its patterned metal structure shapes how it reflects radio waves. In this project, a model uses that response to distinguish seven tag identities.

  1. 01

    A physical pattern

    The tag’s resonant structure carries its identity without an electronic chip.

  2. 02

    A radio response

    The reader illuminates the tag; the reflected response varies with frequency.

  3. 03

    A curve of measurements

    A spectrum records response magnitude across frequency: the model’s input.

  4. 04

    A predicted identity

    The model extracts patterns in the curve and assigns one of seven tag labels.

The tag stays the same. Its measured response may not.

A useful recognition system should tolerate changes in how the reader is positioned. The research question is whether a model can recognise identity across those changes, rather than rely on patterns specific to familiar setups.

What shapes the measurement?

Tag identity + geometry + material + surface + noise

Conceptual contributors, not an additive physical model.
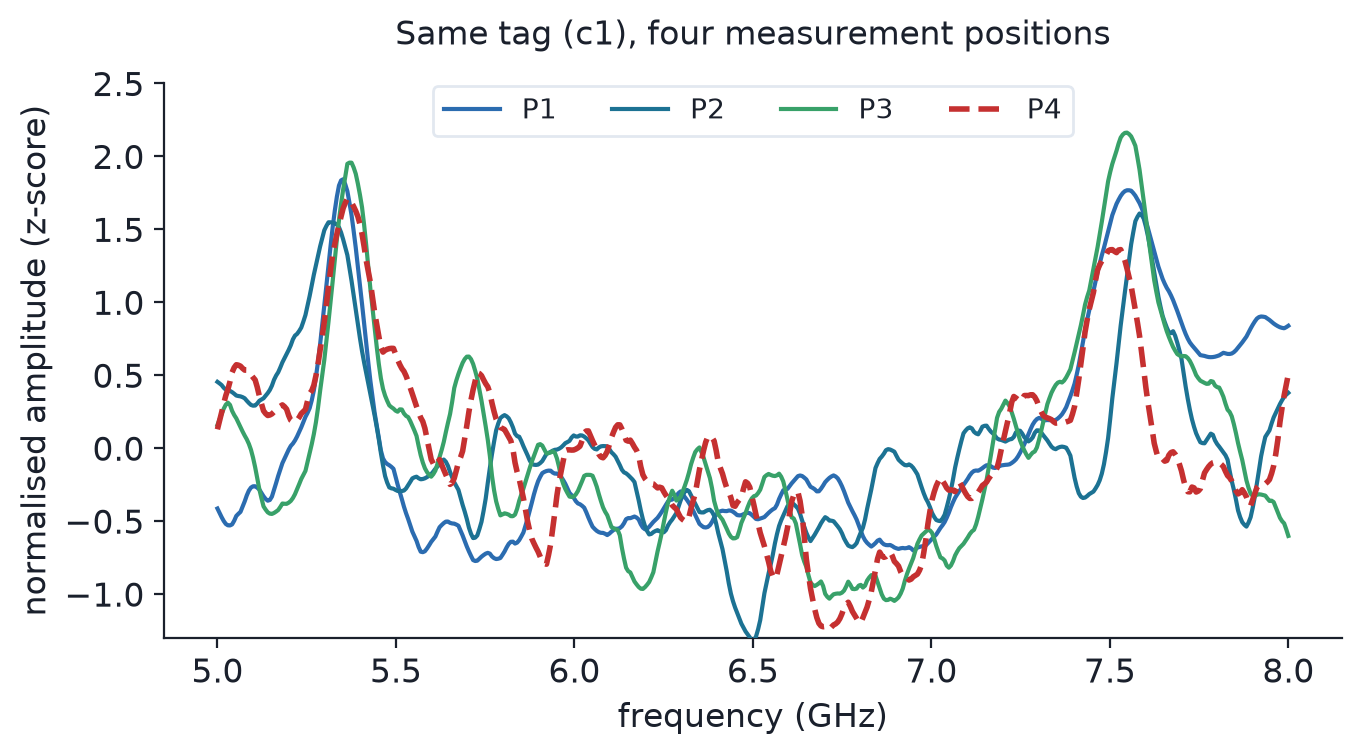
Measured normalized spectral response for the same chipless RFID tag across reader positions P1 to P4.
What domain shift looks like in the data

Same tag. Four reader positions. Four different-looking spectra.

Each line is the same tag measured at a different reader position. The horizontal axis is frequency; the vertical axis is normalised response magnitude. The changing curve shows why recognising the tag at a new position is a different task from recognising another familiar measurement.

Illustrative measured example; it does not identify one unique physical cause of the shift. The plotted GHz axis is nominal; exact sample-by-sample frequency coordinates are unavailable.
Inside the sensor data 281 samples → 280 first differences → 256 learned features

What “RAW” means here

RAW is the supplied 281-point cross-polar radar-cross-section magnitude representation, already cropped from the instrument sweep. The intended band is 5–8 GHz, but the authoritative sample-by-sample frequency axis and crop indices are unavailable. Phase and richer polarimetric channels are also unavailable.

First differencing emphasises local spectral changes and reduces sensitivity to slowly varying baseline structure. The encoder converts these samples into 256 learned features.

Thesis §3.1.4 · pp. 23–24 ↗

To test recognition under change, I needed to keep an entire reader geometry outside model development.

02 / Define the experiment

Train on three geometries.
Test on the fourth.

I asked whether a model developed at three reader positions could recognise tags at a fourth: a new combination of distance and angle. This is domain generalisation—testing an environment excluded from model development.

The missing cornerReader geometry
Distance / angle0°45° 50 mm 150 mm
P4 combines two familiar factors in an unseen way. P2 supplies the angle; P3 supplies the distance. Their joint corner stays outside source-only development.
Select a position to inspect its roleThesis §3.1.2 ↗
One question, a clear boundary

What happens at the missing corner?

P1–P3 provide training and model-selection data. P4 combines the longer distance and rotated angle, and is reserved for final scoring.

Strict source-only evaluation: no P4 measurements or labels are used to fit preprocessing, train the model or choose the recipe in this experiment.

This tests a held geometry within one measurement campaign, not a new installation or independent acquisition.

12,600
measured spectra
7
tag identities
252
condition blocks
3
source geometries
1
unseen joint target
Identify the experimental unit

12,600 rows ≠ 12,600
independent experiments.

Each physical condition was swept 50 times. Different rows can describe the same tag, material, surface and geometry.

7 tags × 3 permittivities × 3 surfaces × 4 positions = 252 blocks. These are physical conditions within one campaign, not 252 independent campaigns.

One condition. One split assignment. All 50 sweeps remain together across the principal train/test boundaries.

Illustration of one block, not measured signal values.
Development · P1 + P2 + P3 only
  1. 01

    Group the physical conditions

    Keep related sweeps together. Fit preprocessing state only on permitted source training data.

  2. 02

    Select using source evidence

    Compare four candidate pipelines by taking turns holding out a source position. Choose the strongest worst-position Macro-F1, a score that gives each tag class equal weight.

  3. 03

    Freeze the complete recipe

    Freeze the selected preprocessing and neural network before scoring P4. Repeat training with five random seeds to examine training variability.

Final evaluation · P4

63 held condition blocks.
3,150 measurement rows.

Evaluate the frozen models across five seeds. Examine accuracy, Macro-F1 and per-class recall.

No target information flows back into development

Scope: the wider research programme had previously examined P4 in other lineages. Strict-DG describes the controlled computation and selection boundary; this is not a historically untouched prospective-target study.

Selection logic, metrics and uncertainty

Why this recipe?

Candidates: raw-spectrum ERM (C0), first-difference ERM (C1), source nearest-class-mean readout (C2), and source CORAL alignment (C3). ERM means ordinary average training-loss minimisation. C1 won the primary worst-held-source Macro-F1 criterion; tie-breaks did not affect selection.

Source-score reuse regret averaged 0.013439. This provides descriptive support within four candidates, not a fresh nested selection experiment or evidence of target-optimal selection.

Thesis §4.2.1–4.2.2 · Tables 8–9 ↗

Why more than accuracy?

Accuracy counts correct predictions. Macro-F1 equally weights each class through precision and recall. Recall measures how often a true class is recognised; zero recall exposes an abandoned class.

Five-seed population SD describes training variability, not a confidence interval. Matched diagnostics use their declared units, including 10,000-replicate paired, tag-stratified condition-block bootstrap intervals and seed sensitivity. These intervals do not represent uncertainty across new installations.

Thesis §3.3 · pp. 30–32 ↗
Historical context: what the 73.44% result does—and does not—show

The historical familiar-geometry model achieved 73.44% accuracy on a condition-grouped split. It motivates the question, but it is not a before/after comparison with the 15.66% result below. The model and evaluation settings differ.

Grouping uses TagID, permittivity, surface and position. An exact-hash review found 4,299 unique signals, but a different hash does not establish independence. Physical metadata defines the grouping.

The historical leave-P4-out accuracy was 0.3185. It motivates the transfer question, but is not a matched comparison with canonical Strict-DG 0.1566: representation, architecture and validation lineage change. The gap cannot be attributed specifically to leakage, governance or selection.

The 73.44% familiar-condition result was already block-grouped. Its limitation is familiar geometry; it is not a demonstrated repeat-leakage result.

Thesis §3.1.3, §4.1 and §4.2.3 ↗

With the complete pipeline fixed, I could measure recognition at P4.

03 / See what transferred

Recognition stayed near
the chance reference.

The selected pipeline averaged 15.66% accuracy at the held geometry. With seven balanced classes, uniform random guessing has a 14.29% accuracy reference. Some tags were almost never identified correctly.

Strict-DG · five-seed mean
15.66%

Accuracy · population SD 3.05 percentage points

0.1122

Macro-F1 · population SD 0.0190

Balanced seven-class uniform-random accuracy reference: 1/7 ≈ 14.29%. A descriptive reference, not a formal significance test.

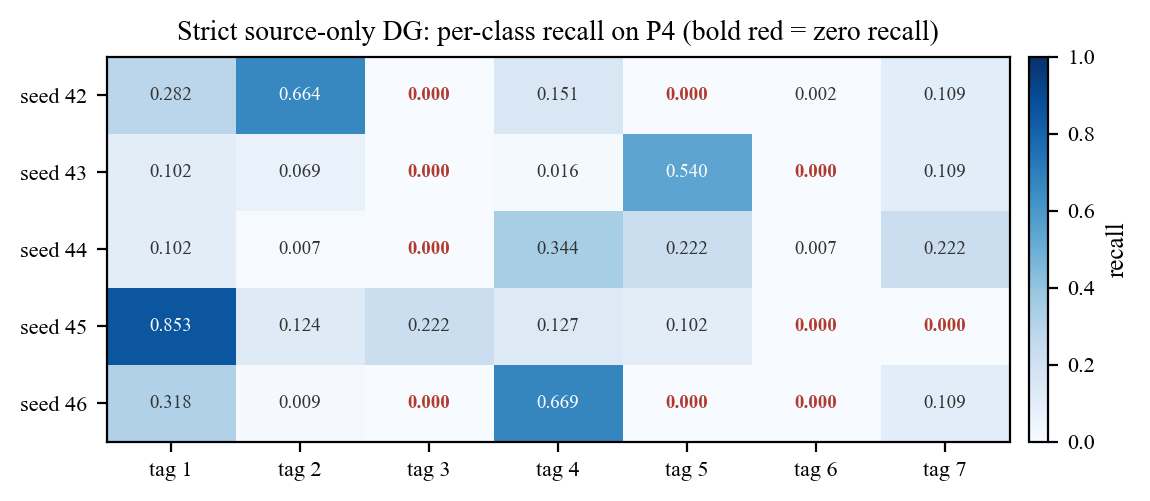
Per-class recall across five seeds. Every seed has at least one zero-recall class; Tag 6 is the most severe pooled case.Enlarge class-recall figure ↗
Each row is a training seed; each column is a tag identity. Recall is the fraction of that tag’s measurements identified correctly. Every seed has at least one tag with zero recall. See thesis Figure 8, p. 38.
4 / 2,250

Correct Tag-6 predictions across five seeds.

Predictions concentrated on a restricted subset of classes. Per-class recall establishes collapse; low Macro-F1 alone does not.

Thesis §4.2.4 ↗
Training variability: the five individual runs
Thesis Table 10 · full held-P4 scores
SeedEpochAccuracyMacro-F1
42130.1726980.123054
43130.1193650.096557
4490.1292060.100795
45100.2041270.144565
4690.1577780.096184

Mean accuracy 0.156635; Macro-F1 0.112231. Dispersion is population SD (ddof = 0).

Read the full result ↗

Five seeds, one held geometry

Accuracy (%)
Changing the random seed changes training, not the acquisition setup. These runs measure training variability within the same held geometry.

The next question was where recognition broke down: the measurement, the learned features or the final classification rule?

04 / Investigate the failure

Follow the signal.
Inspect each stage.

I split the investigation into three questions: is the signal already difficult to distinguish, do the learned features retain useful information, and can a different classification rule help? These are follow-up diagnostics, not replacements for the held-geometry result.

First, check basic learning functionality. All four positions passed the small true-label fitting control. This shows an ability to fit that subset, not generalisation. The P4 control ran after the canonical recipe was frozen. §3.3.3 ↗

Post-freeze · acquisition diagnostic

01 / Is the measurement already difficult?

I trained and tested separately at each position, keeping physical-condition blocks separate. Both rotated positions, P2 and P4, performed poorly. This points to an angle-associated difficulty, rather than a problem unique to the held position; it does not identify a single physical cause.

Within-position recognition

Macro-F1 · row scoring
P1 · 0°0.2348
P2 · 45°0.1194
P3 · 0°0.2164
P4 · 45°0.1322
Train separately at each position; test unseen condition blocks at that position. This is not Strict-DG. Bar scale 0–0.30; means shown, intervals below.
−11.11 pp

Angle-associated block-accuracy contrast

45° minus 0°: 95% paired-block interval [−16.03, −6.35] percentage points. Overall distance and interaction are not confirmed.

Degradation is also present in RAW before learned encoding. Its probe-specific angle contrast (−0.2619) is a different estimand from this CNN factorial effect.

Acquisition intervals and pairing rules

The factorial study synchronised folds, seeds and validation assignment across positions after an inherited pairing problem was found. Contrasts pair the same TagID–permittivity–surface conditions.

Table 11 · within-position pooled-row Macro-F1
PositionMean95% block interval
P10.2348[0.1788, 0.2846]
P20.1194[0.0771, 0.1581]
P30.2164[0.1631, 0.2649]
P40.1322[0.0929, 0.1699]
Table 12 · synchronised block-accuracy contrasts
ContrastEstimate95% interval
Angle−0.111111[−0.160317, −0.063492]
Distance−0.050794[−0.106349, +0.007937]
Interaction+0.114286[−0.028571, +0.260317] seed-inclusive

Angle/distance intervals fix seeds; the governing interaction sensitivity resamples seeds. The seeds-fixed interaction interval is [0.000000, +0.228571]. Distance is not proven irrelevant. Findings are limited to the sampled factor levels.

Thesis §4.3, Tables 11–12; §4.4.3, Table 15 ↗
Post-freeze · labelled linear-probe diagnostic

02 / Do the learned features transfer?

The encoder is the part of the network that turns a spectrum into learned features. I tested those features with a simple classifier—a linear probe—and compared them with the original signal. At P4, the original signal gave a higher mean probe score. The strength of this evidence depends on how training variability is accounted for.

Can a simple classifier recover tag identity?

Macro-F1 · condition-block scoring
RAW spectrumFirst differenceLearned embedding
The encoder was developed using P1–P3, but not P4. The probe itself uses labelled training blocks at each position, including P4. These are diagnostic scores, not source-only deployment scores. Five-seed means; bar scale 0–1.
+0.0951 Macro-F1

Paired RAW-minus-embedding contrast at P4.
95% block-bootstrap interval [0.0173, 0.1747]. Including probe-seed variability gives [−0.0015, 0.1891], which crosses zero.

Probe protocol, exact means and contrast definition

The same Latin-square condition-block splits train a linear softmax probe for RAW (281 features), first difference (280) and the frozen C1 embedding (256). The endpoint pools 63 out-of-fold block-majority predictions per position and seed. Only P4 is encoder-clean.

Thesis Table 13 · five-seed representation means
PositionRAWDifferenceEmbedding
P10.51920.38140.7632
P20.27370.24810.7623
P30.53630.35610.9095
P40.24270.23590.1472

The +0.0951 contrast is the mean of the primary tag-stratified bootstrap contrast distribution, a different estimand from subtracting the separately aggregated means, 0.2427 − 0.1472.

The primary interval supports a limitation in linearly accessible information under this probe. The block-plus-probe-seed sensitivity interval [−0.0015, 0.1891] crosses zero, weakening the strength of that inference. This does not prove that all TagID information was erased or that no other decoder could recover it.

Thesis §4.4.1–4.4.2 · Tables 13–14 ↗
The clue for an intervention92.2%Source-position probe accuracy

The embedding reveals where a measurement came from.

Position is strongly decodable from P1–P3 features; the three-position uniform reference is 33.3%. This is evidence of association, not proof that geometry encoding caused P4 failure.

Thesis §4.4.4 · Figure 12 ↗

Can a targeted intervention turn this diagnostic clue into better transfer?

05 / Test a possible improvement

Can the model rely less
on reader position?

The learned features also reveal the reader position. I tested whether discouraging that information could improve tag recognition. Each method was compared with an ordinary-training baseline using matched settings and seeds.

The idea behind domain-adversarial training (DANN)Training schematic
Keep tag information while discouraging position informationSource spectra enter an encoder. Its features feed both a tag classifier and a position classifier. The encoder is trained to preserve tag discrimination and make position classification harder through reversed gradients. This depicts the intended training mechanism, not an achieved result.Source spectraP1 + P2 + P3EncoderLearned featuresPredict tag identityPreserve useful discriminationPredict reader positionMake this harder for the encoderDANN training: source spectra enter an encoder whose features predict tag identity while position information is discouragedSource spectraP1 + P2 + P3EncoderLearned featuresPredict the tagKeep identityinformationPredict positionMake positionharder to decode
This was the intended mechanism. The experiment did not establish reliable position suppression or improved P4 recognition.
Strict source-only · DANN

Make position harder to decode.

Observation: the source embedding strongly encodes reader position.

Hypothesis: suppressing geometry information may improve transfer while retaining tag discrimination.

Intervention: domain-adversarial training adds a position classifier with reversed gradients. The encoder is trained to make that classifier less successful.

Outcome: neither reliable position suppression nor reliable P4 improvement was established. The causal role of position encoding remains unresolved.

Check the mechanism test

Source-selected weight λ = 0.10. Position-probe Macro-F1 changes by −0.006807 [−0.019896, +0.006788]; TagID-probe change is −0.007686 [−0.026223, +0.010967]. These are DANN's branch-local diagnostics, distinct from the 92.2% accuracy clue.

No reliable matched P4 improvement

Δ Macro-F1
Dots: intervention-minus-matched-ERM effects. Lines: seed-inclusive 95% bootstrap intervals. All cross zero. Separate matched comparisons, not a ranking by absolute score.
IRM · seek a predictor stable across source environments

Invariant risk minimisation tests consistency across P1–P3. The matched P4 effect is negative and uncertain; intended invariance was not established.

GroupDRO · protect the weakest source environment

Worst-group optimisation tests whether emphasising disadvantaged source conditions helps P4. The small target point gain is uncertain.

Exact branch-matched endpoints
Thesis Table 17 · P4 Macro-F1
MethodERMMethod scoreDeltaLower CIUpper CI
IRM0.1187090.099379−0.019330−0.0669390.025387
DANN0.1011160.1171530.016037−0.0355780.068624
GroupDRO0.1124390.1138440.001405−0.0429780.039489
Thesis §5.1 · Tables 16–17 ↗

The source-only methods did not establish reliable improvement. A separate question is whether labelled examples from P4 could help.

06 / Test labelled calibration

What if we can label
the new position?

So far, the primary model had to transfer without P4 data during development. Here I changed the assumption: labelled examples from P4 become available for calibration. This is a separate adaptation study with its own held-condition test.

Primary recognition testDevelop without P4

Freeze the model, then evaluate at the unseen geometry.

Separate calibration diagnosticAllow labelled P4 support

Fit an adapter; evaluate on other physical-condition blocks.

Target-assisted · 500 labelled P4 samples

03 / Can a new classification rule help?

I kept the learned features fixed and used labelled P4 examples to train a new classification rule. Separate condition blocks were reserved for evaluation. I then tested whether updating the encoder as well would help.

0.1427

Held-condition Macro-F1

The target-trained readout has a +0.0404 point effect versus the matched 500-label prototype adapter. Its 95% interval [−0.0409, +0.1165] crosses zero.

Then allow the encoder to adapt.

Partial fine-tuning reaches 0.1319 Macro-F1; full fine-tuning reaches 0.1296. Neither establishes a reliable improvement over the frozen linear readout.

Readout mismatch may contribute. The tested procedures provide limited, uncertain recovery; they do not bound every possible decoder.

Thesis §5.2.5–5.2.6 · Table 21 ↗
Keep the target-assisted studies separate
Each study retains its own comparison and access boundary
StudyEvidenceInterpretation
Historical few-shot3-shot prototype ΔF1 +0.037884 [0.022224, 0.056097]Paired bootstrap over 18 reused-corpus episodes; support/query condition pools disjoint.
Factor-aware supportJoint coverage vs random: −0.004992 [−0.039200, +0.029010]No reliable strategy advantage at a matched 3-shot budget; separate partition and aggregation.
Larger prototype budget20 labels: 0.135560; 500 labels: 0.102347 Macro-F1Nested support, three held-condition query folds. At 50+ labels all 42 support blocks are covered; extra labels add repeats.
500-label readout0.142740 Macro-F1; Δ vs prototypes +0.040393 [−0.040925, +0.116499]Uncertain point recovery, frozen encoder.
500-label fine-tuningPartial: 0.131861; full: 0.129613 Macro-F1Neither improves reliably over the frozen linear readout.

Query labels only score the later calibration experiment; they do not guide a target validation search. Historical zero-shot query Macro-F1 differs from full-P4 Strict-DG because query partitions and aggregation differ.

Thesis §5.2 · Tables 18–21 ↗
Why 57.71% accuracy and 0.9835 Macro-F1 are not transfer solutions

Historical retrospective carrier: accuracy 0.577143 and Macro-F1 0.583569 came from one seed, a different representation lineage and readout promotion using full P4 outcomes. There was no independent target test set for that selection. Most of the gap to C1 predates that readout choice; individual causes are not identified.

Matched P4-validation selection (A1 − A0): Macro-F1 +0.002304 [−0.001057, +0.006679], using protected P4-Test labels within represented physical conditions. This is not full-P4 retrospective selection.

Within-condition A2: a target-fitted linear rule reaches 0.983494 Macro-F1 when the same physical conditions occur across partitions. Leave-permittivity-out and leave-cell-out controls reach 0.1432 and 0.0865. Dependence-inflated interpolation does not demonstrate held-condition transfer.

Thesis §5.3 · Tables 22–25 ↗

Neither the tested source-only interventions nor the later calibration procedures established reliable recovery. Together, they help define what the next study needs to test.

07 / The engineering implication

What this investigation
established—and taught me.

The tested pipeline did not reliably recognise tags at the held geometry. The follow-up experiments found angle-associated difficulty and evidence of a representation-transfer limitation, with uncertainty. They did not isolate one cause or establish a reliable remedy.

Physical signal

Some difficulty exists before the network.

RAW diagnostics show angle-associated degradation. P4 is the unseen joint corner, not a uniquely unreadable position.

Inspect the signal evidence ↗
Learned representation

Source discrimination need not transfer.

At P4, the original signal has a higher mean linear-probe score than learned features. The strength of the contrast is sensitive to probe-seed variability.

Inspect the representation evidence ↗
Decision rule

A replacement head is only part of the question.

Target-trained readouts and encoder updates provide limited, uncertain recovery under the tested held-condition protocols.

Inspect the readout evidence ↗

Engineering capabilities demonstrated

  • Problem formulationReframed a classification task as an unseen-geometry deployment question.
  • Evaluation engineeringBuilt block-aware, source-only selection around the physical data-generating process.
  • Failure localisationSeparated evidence across acquisition, representation and readout rather than treating model failure as one undifferentiated problem.
  • Domain-shift reasoningTurned diagnostic clues into controlled IRM, DANN and GroupDRO tests with branch-matched baselines.
  • Reproducible researchKept access regimes, uncertainty, stopping gates, retained predictions and negative results explicit and reproducible.
Why this matters beyond RFID

The transferable skill: designing meaningful tests for machine learning on physical sensor data. The same reasoning pattern applies whenever a physical sensor sees a shifted environment: define the real deployment unit, keep evaluation boundaries honest, then debug the measurement, representation and decision rule separately.

Sensor algorithmsBiomedical signalsIndustrial monitoringEdge / embedded validation
The next useful experiment

Test new measurement conditions with a fixed protocol.

Fix additional held geometries before development. Test whether an intervention actually reduces position decodability while retaining tag information. Preserve the frequency axis and richer measurements to test physical explanations directly.

One tag family, one campaign, three sources and one held target limit external validity. Five training seeds and resampling cannot substitute for independent deployments. Thesis §6.2–6.3 ↗

Go deeper

The evidence behind
the decisions.

The dissertation is the scientific source of truth. Principal results link to their governing sections; supporting explorations retain their own claim boundaries.

Why the Mixup experiment stopped before training
Feasibility stop · no performance result

Mixup never became a performance experiment.

50%eligible pair coverage>99%required by the protocol

Cross-position interpolation required matching physical conditions in each training split. Only 2,100 of 4,200 parent-pair opportunities remained. I retained the failed gate rather than changing the split to obtain a score.

The raw factorial data are complete; the incompatibility is split-induced. This does not show that Mixup is ineffective. A jointly matched split would be a new experiment. §5.1.5 ↗

Reproducibility: what was independently checked?

The research release separates study entry points, configurations, data-access contracts and claim boundaries. Predictions and evidence records were frozen for the final interpretation.

Canonical models: five final Strict-DG models were retrained in the locked environment; retained P4 predictions and headline metrics reproduced exactly. Source selection: 60 retained candidate–fold–seed units were replayed, independently re-scored and re-ranked, rather than fully retrained.

Historical baselines were substantially, but not completely, reproduced. Some supporting branches rely on reconstructed or replayed evidence. These are the dissertation’s recorded checks; reproduction scope depends on the retained inputs for each branch.

Appendix D · reproducibility and governance ↗
External data and self-supervision Scoped portability, no transfer rescue

The external four-class corpus has a different tag codebook. Good within-corpus performance establishes scoped pipeline portability, not transfer of the seven-class model.

The separate source-only SSL study allowed unlabelled external data while excluding P4 from development. No treatment established a reliable or practically meaningful benefit over its branch-specific supervised control. That control is distinct from C1.

Dissertation Appendix E ↗
OpenEMS design exploration Confirmation criteria not met

The best recorded simulation candidate gained 0.681% in minimum spectral separation, below the recorded 5% practical gate. Pilot-confirmation mismatch was 7.028 dB, with 550 MHz maximum peak drift. Confirmation criteria were not met; fabrication was not recommended.

The model omits the complete measurement chain, including antennas, cross-polar receive path and acquisition geometries. The exact candidate universe, ranking configuration and timing of threshold specification remain unresolved. No R2 follow-up simulations ran.

No measured hardware, RF or classification improvement is claimed. This is exploratory design evidence, not a validated hardware result.

Dissertation Appendix F · Table 34 ↗
Peak and noise hypotheses Negative and validity-limited evidence

The four-peak descriptor had about 11.7% missing frequencies, exceeding its 5% extraction-validity threshold, and is excluded from quantitative representation comparisons. Missingness was lowest at P4, so missing peaks do not directly explain P4 collapse.

The peak-collision rule flagged all 21 tag pairs: a 100% false-alarm rate under both collapse definitions. It did not distinguish collapsing pairs. Synthetic noise-floor augmentation gave gains below seed variability, with a disclosed protocol amendment; no reliable remedy or refutation of a noise mechanism was established.

Thesis §4.4.5–4.4.6 and Appendix G ↗

Class-recall evidence

Existing project figure; interpretation verified against dissertation §4.2.4.